Rupiah value history: Why massive shifts defined currency
"The history of the Rupiah is a story of radical shifts, from massive devaluations to modern stability, reflecting the nation's turbulent journey toward economic maturity."
The Rupiah value history reveals a transition from extreme volatility to a managed modern economy. This article explores how historical fluctuations shaped the currency and provides a comparison of past and present economic indicators.
Key takeaways: * Historical volatility included massive parallel-market premiums and sudden devaluations. * Modern stability is reflected in relatively low inflation rates in the mid-2020s. * Currency shifts were often driven by government interventions and global economic crises.
How did the Rupiah value history change through extreme volatility?
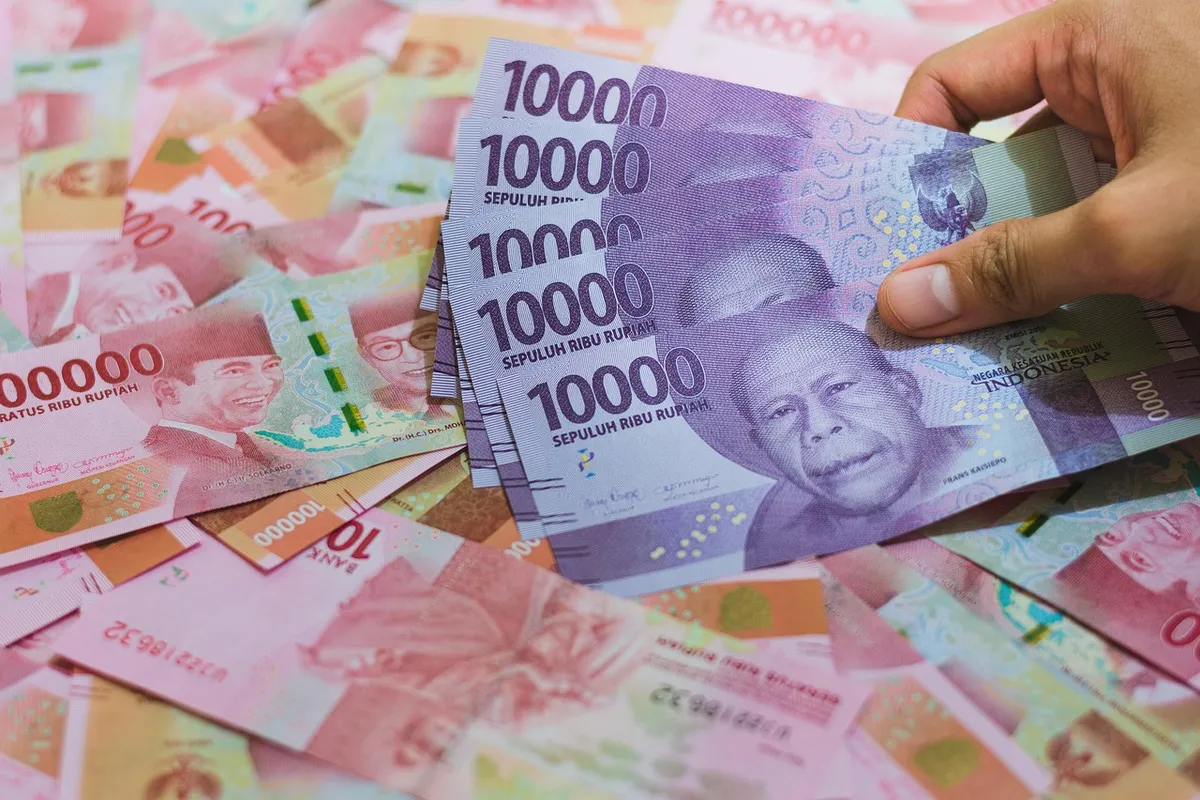
At dusk in the crowded market, a trembling hand clutches a handful of rupiah while the scent of rain fills the air.
A hand reaches for an old banknote, tracing the lines of a currency that once held vastly different purchasing power. In the mid-20th century, the Rupiah faced massive shifts that redefined its role in the domestic economy.
During periods of instability, the currency underwent dramatic changes. In March 1958, the market price of certain notes rose to 332% of their face value before government intervention occurred.
On 25 August, the government implemented drastic measures, reducing the face value of Rp500 and Rp1,000 notes to one-tenth, freezing 90% of bank deposits above Rp25,000, and devaluing the official rate to Rp45 per dollar.
These fluctuations created a landscape of unpredictable Indonesian currency change. Multiple exchange rates persisted during these eras. Parallel-market premiums reached 2,678% in July 1962 and climbed to 11,100% in November 1965. Such massive swings meant the value of money was often in flux.
What does the Rupiah economic history tell us about policy shifts?
At dawn in the quiet office, a policymaker sighs while tracing the jagged lines of a graph depicting the rupiah.
A policymaker reviews a ledger, weighing the impact of interest rates and exchange bands on the national economy. The transition from fixed to floating rates marked a turning point in how the nation managed its wealth.

In the 1980s and 1990s, the government actively managed the currency's value. On March 30, 1983, the government devalued the rupiah by 27.8 percent while reconfirming a free foreign exchange system and a managed floating exchange rate policy.
This period saw various attempts to balance export competitiveness and inflation.
The Indonesian rupiah economic history shows that these policies were often reactive to crises. During the first half of the 1990s, the rupiah depreciated against the dollar by about 5% a year. This was part of a policy to offset the difference between Indonesian inflation and its trading partners.
According to World Bank, the 2025 record includes 1.9%.
How has the money value evolution stabilized in recent years?
A modern citizen uses a smartphone to check a digital wallet, noting the steady, predictable numbers on the screen. After the volatility of the late 20th century, the currency entered a phase of more controlled movement.
Following the Asian financial crisis, the system underwent significant changes. Inflation fell from 77.6% in 1998 to 2.01% in 1999, and legislation enacted that year confirmed the floating exchange-rate system. This shift helped move away from the extreme spikes seen in the 1960s.
The money value evolution indicates a move toward more predictable economic environments. By mid-December of a recent period, the currency's depreciation from the end of 2019 had narrowed to 1.72% due to Bank Indonesia's intervention in the spot and domestic non-deliverable forward markets.

According to International Monetary Fund, the 2026 record includes 3.3%.
How does modern versus past Rupiah compare in terms of inflation?
A student compares two different eras of economic data, looking for patterns in rising and falling prices. Comparing the extreme inflation of the late 1990s to the stability of the 2020s highlights the progress made.
According to data from the World Bank, Indonesia recorded inflation of 1.9% in 2025.
The differences between the eras are stark. In the late 1990s, the intervention band for the currency expanded from 1% in January 1994 to 12% in July 1997. In contrast, more recent data shows much lower levels of price increases.
| Era | Inflation Context |
|---|---|
| Late 1990s | Inflation fell from 77.6% in 1998 to 2.01% in 1999 |
| Mid-2020s | 2025 inflation was 1.9% and 2026 was 3.3% |
Looking at the table, it is clear that the scale of inflation has shifted significantly. I observed how the 2026 inflation rate of 3.3% is much more manageable than the 77.6% seen in 1998.
How do we understand current currency change economic effect?
A merchant counts coins at a register, noticing the specific denominations used in daily transactions. Understanding the current state requires looking at the specific tools and denominations used in the modern economy.
Current circulation shows a reliance on specific denominations. By value, Rp500 and Rp1,000 coins together accounted for about 84% of coins in circulation in May 2026. Bank Indonesia groups Rp100 and lower denominations together in its circulation statistics.
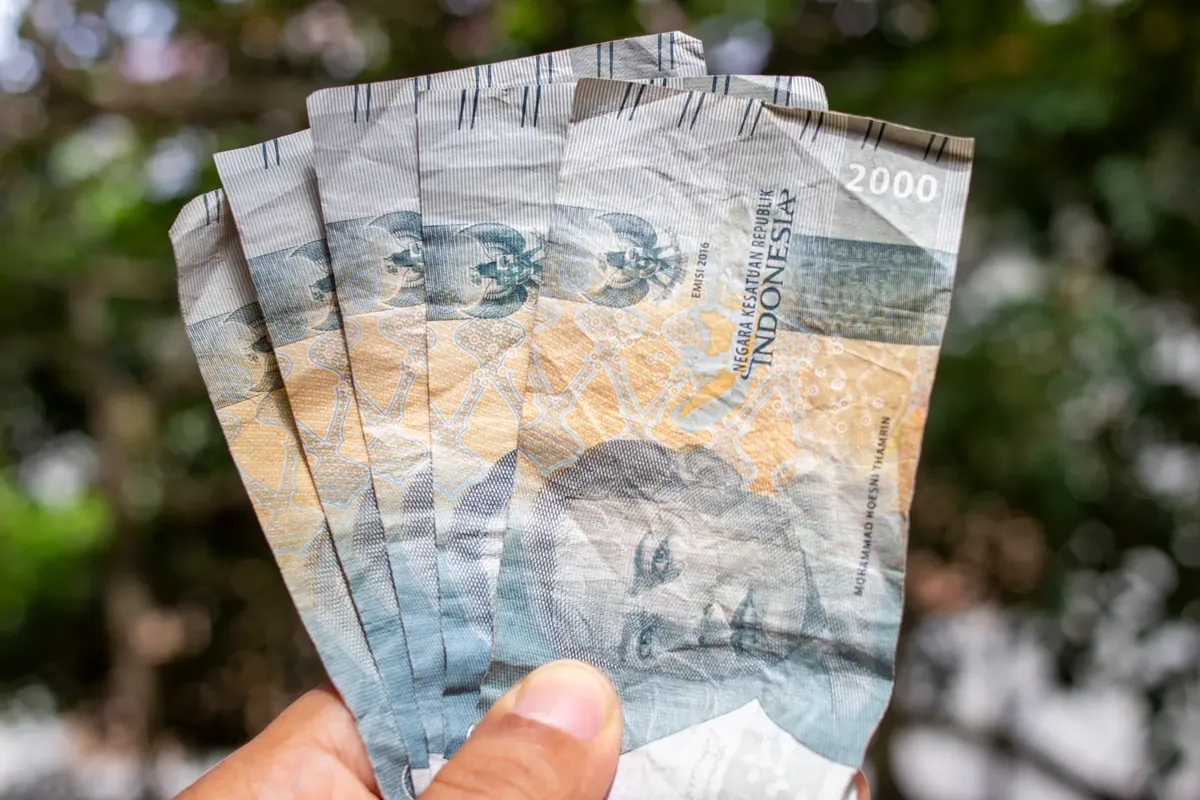
The currency change economic effect is also managed through interest rate adjustments. Bank Indonesia raised its policy rate by 50 basis points in May, then by 25 basis points on 9 June, and another 25 basis points on 18 June, bringing it to 5.75%.
These moves aim to maintain stability in a modern context.
- How did the Rupiah value history change through extreme volatility?
- What does the Rupiah economic history tell us about policy shifts?
- How has the money value evolution stabilized in recent years?
The subject here is Rupiah value history.
The same subject is also called Currency reform impact.
This part also covers Rupiah value political shifts.
Related








Comments 0